
A newly released national map has sparked attention across the mining world, revealing a reshaped view of America’s underground wealth. It highlights where the country’s most significant gold deposits lie, redrawing the boundaries of opportunity and intrigue. Without unveiling specifics, the update points to regions whose influence may redefine the nation’s relationship with this timeless metal.
Where the map starts and why it matters
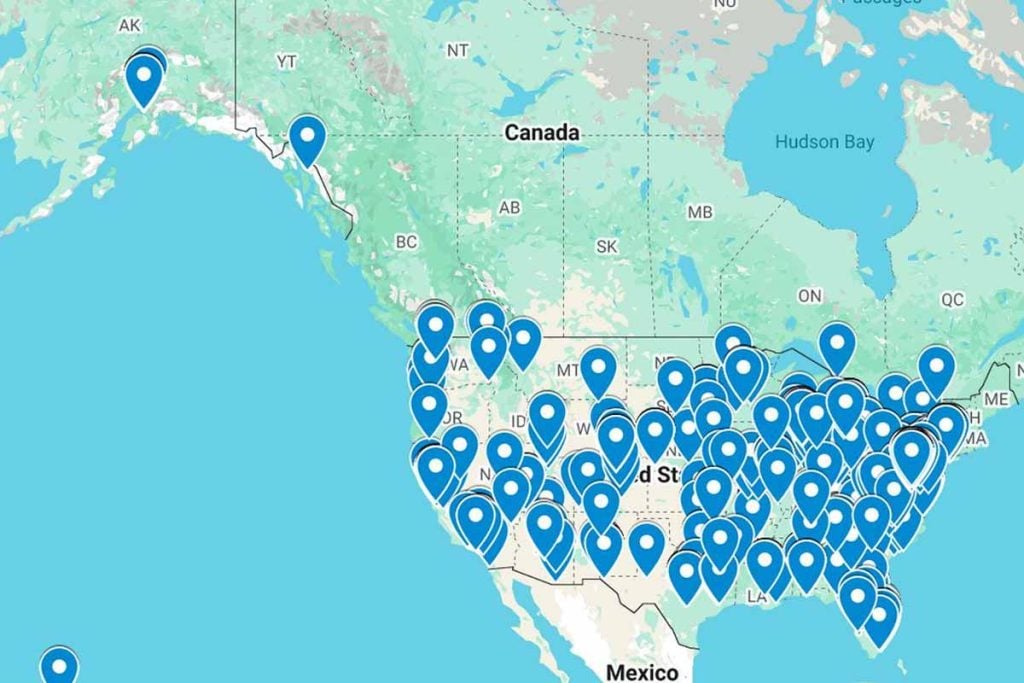
More than 40 lode mines and several placer operations fed U.S. output in 2024, while the largest 26 mines supplied nearly all domestic volume. About 15 refineries handled commercial flows, which shows how concentrated the system is. The underlying dataset comes from the U.S. Geological Survey’s Mineral Commodity Summaries 2025, prepared by Kristin N. Sheaffer.
A lode deposit means gold locked in rock. A placer deposit means loose grains concentrated by water. Both occur across the West and in Alaska, yet scale differs widely because geology is uneven. The new map turns that unevenness into a clear visual, so the main belts stand out and smaller districts still register.
Nevada’s Carlin Trend anchors the picture. It is a cluster of disseminated, microscopic gold that shaped modern U.S. mining. Thanks to that district, Nevada supports large open-pit and underground operations. Permitting experience, skilled crews, and existing plants reinforce the state’s advantage, so throughput stays high and costs remain competitive.
How gold deposits concentrate in a few dominant states
Nevada accounts for about 70% of U.S. mine output, with Alaska at roughly 16%. This split explains why the West dominates. Nevada’s concentration of Carlin-type deposits allows efficient mine designs, strong recovery, and steady capital cycles. Employment at U.S. gold mine and mill sites ran near 12,000 workers in 2024 because big plants drive most tonnage.
The state’s depth of mining services also matters. Contractors, labs, and equipment suppliers shorten ramp-ups and keep downtime lower, while experience with environmental reviews streamlines expansions. Those practical advantages amplify geology, so the production share remains outsized even when individual mines change hands, expand, or transition from open pit to underground.
Alaska keeps second place with very different terrain. Hard-rock mines and large placer systems share the stage, while remote logistics shape every schedule. Weather windows, power lines, and ports create constraints; however, the resource base offsets them. In this mix of assets, gold deposits link to copper systems, which expands exploration targets and keeps new prospects coming.
What Alaska adds, from geology to long-term supply
Alaskan producers often encounter gold alongside copper in porphyry-related systems. That matters for planning because discoveries can feed multiple metals into the same processing chain. The United States, in total, holds an estimated 33,000 tons of identified and undiscovered resources, and nearly one quarter of the undiscovered portion is likely in porphyry copper deposits.
Those figures explain why the West and Alaska remain central for the next wave of projects. Mine plans depend on economics and technology; however, the resource map says runway exists for decades. As financing rotates and permitting timelines shift, developers sequence assets so mills stay full, while earlier sites backstop new starts with shared infrastructure.
The workforce and supply chain reinforce that timeline. Experienced teams move between districts as projects advance, and shared contractors lower learning curves. Because mills and roads last for decades, communities gain durable economic anchors. In this context, gold deposits are not just dots on a map; they are hubs that concentrate capital, skills, and long-term jobs.
Prices, demand, recycling, and the pull of gold deposits
“Gold once again dominated headlines in 2024, with prices reaching 40 record highs last year,” said Louise Street of the World Gold Council. The average U.S. government estimate for 2024 was about $2,400 per troy ounce, up roughly 23% from 2023. Jewelry volumes eased, while the dollar value of demand rose because prices climbed.
Global use divides mainly into jewelry, investment, and official sector demand. In 2024, jewelry took about 45% of consumption, central banks and other institutions 21%, physical bars 19%, coins and medals 7%, and electronics 6%. When prices firm, investors rotate toward physical holdings, and refiners adjust runs because recycled feedstock becomes more attractive.
Domestically, around 90 tons of scrap were recycled in 2024—both new and old—making up about 45% of U.S. consumption. Recycling dropped roughly 6% from 2023, which put more focus on mine supply and imports. Because investors watch these balances closely, market swings can speed decisions about new shafts, plant debottlenecking, and exploration budgets.
From pits to refineries to global trade: the U.S. pipeline
Worldwide mine production in 2024 reached nearly 3,300 tons. The top five producers—China, Russia, Australia, Canada, and the United States—set the competitive context. The U.S. resource base far exceeds yearly output, so timing hinges on economics, permitting, and technology rather than resource scarcity. Meanwhile, the Treasury carries gold at a statutory $42.2222 per ounce.
Supply is more diverse than mine output alone. About 7% of U.S. supply comes as byproduct from processing domestic base-metal ores, chiefly copper, before refining to high purity. Fabrication then takes over. Jewelry manufacturing clusters in New York, New York, and Providence, Rhode Island, with smaller hubs in California, Florida, and Texas that serve regional retail.
Trade ties round out the flow. Switzerland and Canada have been key partners for bullion shipments, while Mexico and Colombia supply significant dore cargoes. These routes keep metal moving even when mine output shifts. Because costs, prices, and investment patterns change together, planners use the map to track where gold deposits push the next ounces.
What the new map signals about the next U.S. ounces
Trace the metal to its source and the pattern holds: Nevada dominates, Alaska contributes strongly, and several Western states add smaller but steady streams. The rest of the system—refineries, fabricators, and trade lanes—keeps supply flexible as projects evolve. Because prices, recycling, and investment all reinforce each other, gold deposits will keep guiding where capital flows.