
A buried trove can stir markets, yet this one also asks for patience. Early work in Hunan points to a massive system, with models still sharpening the picture. The estimate exceeds 1,000 metric tons and values near 600 billion yuan. Shallow drilling already indicates about 300 tons. The science now turns from hints to proof, and gold headlines meet the quieter math of cores, assays, and grade.
What the new estimate really says about gold
More than forty mineralized veins have been mapped near 2,000 meters, with models projecting to 3,000 meters. That is roughly 6,560 to 9,840 feet. Resource figures this early are guideposts, not vault totals. Each new hole can lift or trim tonnage, because averages tighten as sampling grows.
Ore grade explains the stakes. It measures concentration in grams per ton, written g/t. Higher values mean fewer truckloads for the same poured metal. Because of that, gold systems with stronger averages waste less rock, run smaller plants, and recover costs faster, even when shafts go deep.
This is still a first pass. The deposit has moved from a hunch to a testable target. Field work and reporting come from the Geological Bureau of Hunan Province and the Hunan Provincial Institute of Geology. Scale needs context, too. South Africa’s South Deep lists 27.998 million ounces, close to 870 tons, as proven and probable reserves.
How teams modeled the deposit at depth
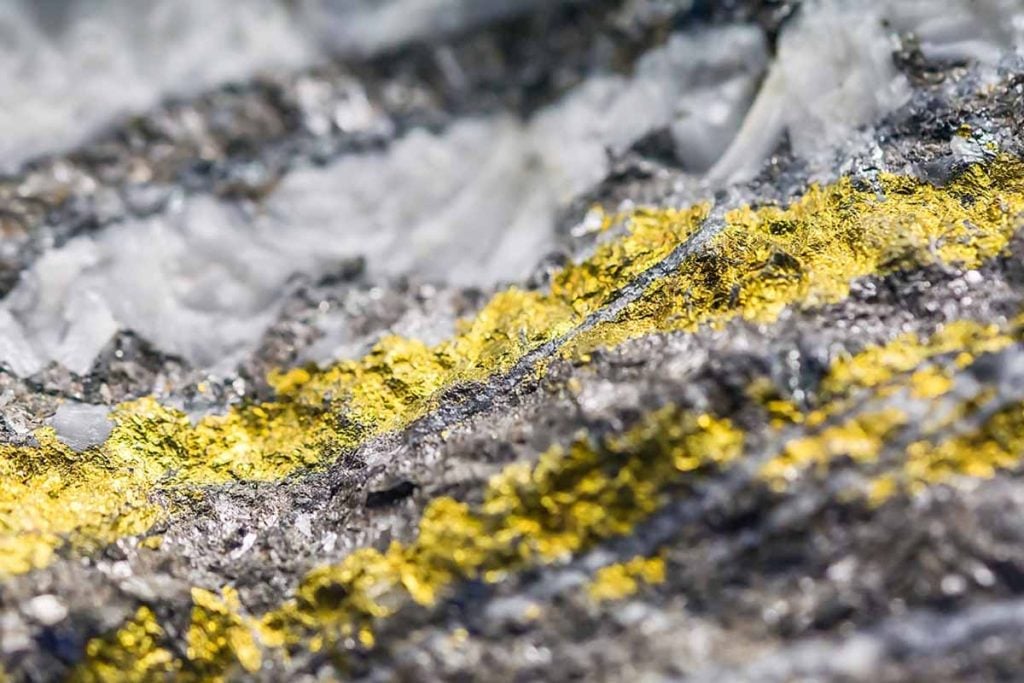
Geologists logged tens of thousands of feet of core, then stitched structures with 3D models. They traced where veins bend, split, and rejoin. That long, patient routine links scattered intercepts into shapes that engineers can someday mine. One spectacular sample reached about 138 g/t at around 2,000 meters.
According to Chen Rulin of the provincial bureau, many cores showed visible native metal. That excites drill crews, yet one bright slice does not set an average. Miners need consistent thickness and grade. In practice, gold plans lean on continuity more than on isolated sparkling intervals.
Average grade decides efficiency. Continuity decides safety and cash flow. Together, they outline a path to payback. The best zones connect, hold thickness, and sit close to access. Those clusters anchor early designs, while thinner splays wait. Good models rank targets, focus budgets, and cut risk before steel meets rock.
Costs, grades, and what determines mine plans
Depth adds heat, water pressure, and hoisting time. Ventilation and ground support grow expensive. Grade offsets those loads. In orogenic systems, values can swing within a few feet. That volatility creates both bonanza shoots and long lean stretches that slow production if schedules ignore geology.
A recent USGS synthesis notes many deposits in this class cluster at higher grades, with half cataloged at or above roughly 16 g/t. That median reminds planners to expect variety. Because of that variance, gold mines pivot often, blending stopes to balance feed, recovery, and safety across weeks and quarters.
Cutoff grade rises with cost. When energy, labor, support, and dewatering tighten margins, engineers trim the plan. They chase thicker, richer zones and leave the rest. Smart scheduling reduces waste, steadies mill throughput, and protects crews. The math stays simple: mine what pays, defer what does not, and revisit as prices move.
Regional clues that focus the hunt for gold
The Wangu field sits in the Jiangnan orogen, where ancient crust met, slipped, and sheared. Those wounds let hot fluids move and drop metal. Peer-reviewed work calls northeastern Hunan the most important district in this belt, with resources above 315 tons before the latest announcements reshaped attention.
Several 2024 studies describe overlapping pulses of mineralization. That pattern helps explain why veins here can be thick and persistent. Typical rocks include quartz veins, altered slates, and breccias. Wall-rock alteration such as sericitization and carbonation marks fluid pathways. Each feature guides teams toward the next intercept and steadier models.
Late Mesozoic granites and northeast-trending faults frame many deposits nearby. Structure is not a footnote; it is the map. Faults control where ore shoots climb or fade. Because structure repeats, 3D tools can project likely targets below the deepest hole. Those rails point toward gold corridors still waiting for proof.
What happens next if drilling confirms continuity
Resource math will shift as more assays return. Early totals may lift or fall. Averages often drift toward the middle as low-grade rock fills gaps between rich streaks. Investors and policymakers will watch reserve conversion, the step when targets harden into bankable tons with engineering behind the promise.
If deeper holes confirm thick, connected shoots at useful grades, the project advances. Teams will refine models, launch studies, and weigh shafts, ventilation, power, water, and backfill. Plan quality matters more than speed. Financing needs confidence that gold can be mined safely and profitably for years, not months.
If better intervals shrink or scatter, designs tighten. Crews focus on consistent pockets first. That approach protects capital while keeping flexibility for future gains. Either path follows the right playbook for this belt. The neighborhood is right. The science now needs to prove length, thickness, and grade together.
Why patience and context now matter more than headlines
Big numbers need context, because deposits grow or shrink under the drill bit. The early estimate above 1,000 tons is impressive, and shallow work suggests about 300 tons already indicated. Yet the value in gold only turns real when models confirm connected, mineable zones that repay the heavy cost of depth.